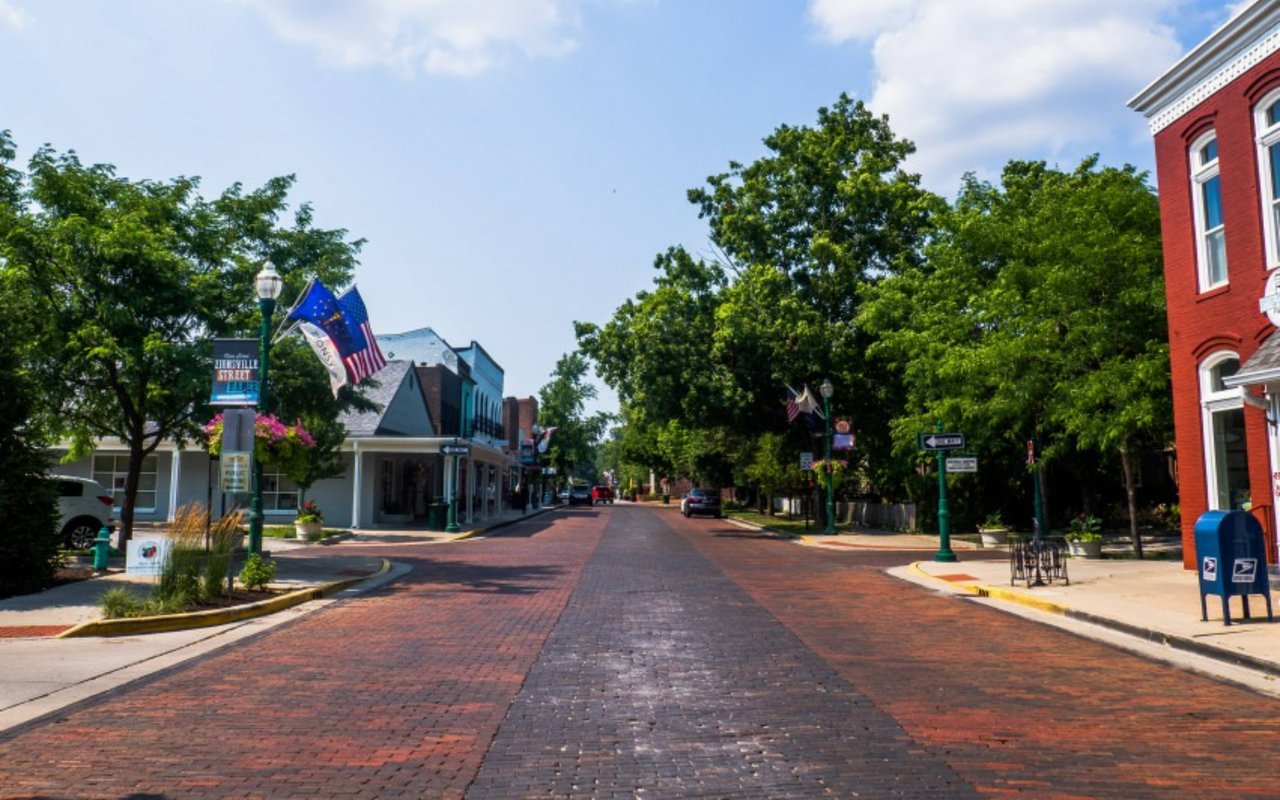
The Village of Zionsville (aka downtown Zionsville is a made up of several desirable neighborhood sections in Zionsville, Indiana. The Village includes the areas of Crosses + Flora Minor Plat + Olivers + Pollard Minor + Schicks + Shaffers Secondary. Homes in the Village are within walking distance of many local restaurants and boutique shopping opportunities, as well as parks and the library.
31,442 people live in Village Of Zionsville, where the median age is 42.6 and the average individual income is $81,165. Data provided by the U.S. Census Bureau.
Total Population
Median Age
Population Density Population Density This is the number of people per square mile in a neighborhood.
Average individual Income
There's plenty to do around Village Of Zionsville, including shopping, dining, nightlife, parks, and more. Data provided by Walk Score and Yelp.
Explore popular things to do in the area, including Julian Coffee Roasters, WestClay Wine and Spirits, and Green Apple Active Lifestyle Boutique.
| Name | Category | Distance | Reviews |
Ratings by
Yelp
|
|---|---|---|---|---|
| Dining | 4.46 miles | 6 reviews | 5/5 stars | |
| Dining | 4.88 miles | 12 reviews | 5/5 stars | |
| Shopping | 3.64 miles | 5 reviews | 5/5 stars | |
| Active | 3.68 miles | 12 reviews | 5/5 stars | |
| Active | 3.81 miles | 5 reviews | 5/5 stars | |
| Active | 3.44 miles | 6 reviews | 5/5 stars | |
| Beauty | 2.97 miles | 27 reviews | 5/5 stars | |
| Beauty | 3.78 miles | 10 reviews | 5/5 stars | |
| Beauty | 3.62 miles | 5 reviews | 5/5 stars | |
|
|
||||
|
|
||||
|
|
||||
|
|
||||
|
|
||||
|
|
Village Of Zionsville has 11,627 households, with an average household size of 2.69. Data provided by the U.S. Census Bureau. Here’s what the people living in Village Of Zionsville do for work — and how long it takes them to get there. Data provided by the U.S. Census Bureau. 31,442 people call Village Of Zionsville home. The population density is 467.78 and the largest age group is Data provided by the U.S. Census Bureau.
Total Population
Population Density Population Density This is the number of people per square mile in a neighborhood.
Median Age
Men vs Women
Population by Age Group
0-9 Years
10-17 Years
18-24 Years
25-64 Years
65-74 Years
75+ Years
Education Level
Total Households
Average Household Size
Average individual Income
Households with Children
With Children:
Without Children:
Marital Status
Blue vs White Collar Workers
Blue Collar:
White Collar:
Work with a team that combines experience, strategic marketing, and dedicated service to guide you confidently through every step of your real estate journey.